
In All of Us—a teachers’ guide which describes itself as a Health and Physical Education resource for “understanding gender diversity, sexual diversity and intersex topics”—the claim that “10% of people are same sex attracted” is highlighted along with other statistics in a special page layout:
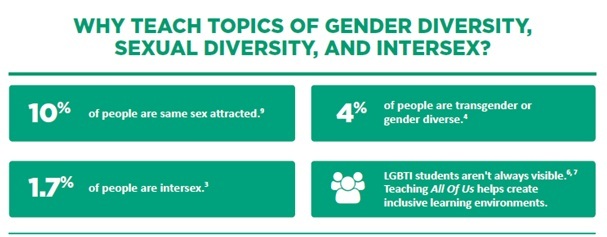
From the All of Us unit guide, page 8
In addition, the reader is directed to a footnote:
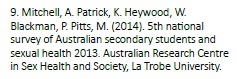
From the All of Us unit guide, page 55[1]
The claim that “10% of people are same sex attracted” is also found in many other Safe School publications including, for example, the web page “Homophobic behaviour”, and the pdf documents Safe Schools Do Better (p. 6), “Stand Out” (pp. 6 & 8), “Kaleidolesson” (pp. 3, 7 & 8), and “OMG My Friend’s Queer” (p. 11). Of these, only Safe Schools Do Better also offers a footnote.
The existence of a footnote is intended to make the statement seem authoritative: 10% is not just a figure out of the blue, it is from a trustworthy source, and if that is what it says there, it must be true. However, the footnote’s academic standing is rather undermined by its failure to provide a page number. Consequently, one has to search through the whole publication (some 80 pages), only to find that one’s search has been in vain. There is no such statement.[2]
What one does find, is an assertion that the numbers for same-sex attraction have been “surprisingly consistent” over the years,[3] but this is contradicted later in the document when the data for same sex attraction is presented. There it is declared that:
These numbers are higher than in previous surveys and may indicate an increased number of young people prepared to come out as experiencing same sex attraction. (p. 23)
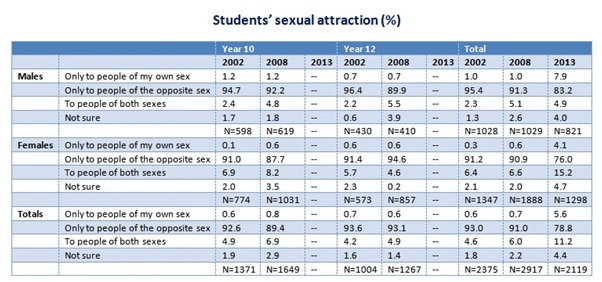
Comparing the results for the 3rd, 4th, and 5th Surveys (2002, 2008 and 2013), it is clearly not true that “the findings remain surprisingly consistent”.[4] In 2002 the percentage of students attracted only to the same sex was 0.6; in 2008 the percentage was 0.7; but in 2013 the percentage jumped to 5.6. When we look at the figures for just boys the increase looks even more marked: from 1.0% in 2002 and 2008 to 7.9% in 2013.
Surely variations of this magnitude require a serious attempt at explanation on the part of the researchers, but instead, the size of the increase is concealed by the statement that “the findings remain surprisingly consistent”; and when an increase is acknowledged, its magnitude is not conveyed at all. Moreover, the conjecture that the higher results “may indicate an increased number of young people prepared to come out as experiencing same sex attraction” seems disingenuous, given a) that completing an anonymous questionnaire is hardly “coming out”, and b) that the researchers know that the results are being skewed by the unrepresentative nature of the sample they have used (as we shall see below).
In the 2008 Table (Table 5.3) the results for 2002 and 2008 were placed side by side for easy comparison. The 2013 survey report does not offer this convenience, so one has to actually consult the previous reports in order to compare results. This I have done, and I have prepared a table for all three surveys. Note that the 2013 survey does not break down the results by year level.

Online Questionnaires
When considering the 2013 results it has to be borne in mind that the survey includes results from online questionnaires submitted by random respondents. This makes its reliability highly suspect.[5]
... once La Trobe University HEC approval was granted for online recruitment, information about the online survey was distributed among existing contact networks and Facebook advertising began. First responses were received on 15 October 2013 and the survey was open until 16 December 2013. Potential participants visited a website that provided them with information about the study in language and design appropriate for their age. If they chose to proceed to the survey they clicked on a tab “Take the National Survey” which took them to the Information Statement that described the study in detail and clearly specified who was eligible to participate. Participants were unable to proceed to the next stage of the survey unless they agreed that they fell within our set inclusion criteria of being an Australian secondary student currently enrolled in Years 10, 11, or 12, and that they had read the Information Statement that described the study in detail. (p. 6)
Out of the 2136 individuals surveyed, 775 were random online respondents (36.3%). The remainder, 1362, were students from 26 schools in years 10, 11, and 12, who filled in the questionnaires under exam conditions. The organisers have elected to not compare the results from the two cohorts in their report, so we are unable to make any judgment as to the trustworthiness of the online non-school-based survey results. From their description of the process, I cannot see how the researchers ensured that the online system could not be abused.
The fact that the researchers write that “the recruitment of an online sample may also account for increased numbers of same sex attracted young people” suggests that they are aware that the average percentages were raised by the online non-school-based cohort. In fact the use here of the word “may” smacks of obfuscation, since at another point in the text they unequivocally state that “there was a higher proportion of same sex attracted young people in the ROS sample”. Higher by how much one wonders.[6]
Returning to the statement “10% of people are same sex attracted”, we can see that it cannot legitimately be attributed to the 2013 survey. Firstly, the phrasing of the statement implies that it is true for the whole population of Australia, but the survey is based solely on a sample of Australian schoolchildren in the upper secondary years. It would be more accurate to say that 10% of older Australian schoolchildren are same-sex attracted, except that, apart from the word “people”, the figure of 10% is also wrong. According to the flawed 2013 survey, the figure is 16.8% if we include bisexual attraction, and only 5.6% if we don’t.
The only way to arrive at a figure of 10% is to lump together the “not sure” with the homosexuals (5.6 + 4.4). However I can see no reason to assume that the “not sure” are “same-sex attracted”. Surely if they were they would know.
It seems then that the figure of 10% in the All of Us unit guide cannot have come from the 5th National Survey of Australian Secondary Students. Maybe it was just pulled out of the blue.
Given the unrepresentative nature of the sample used for the 5th National Survey,[7] it would be better to do what the authors of the All of Us unit guide seem to have done and disregard the 2013 survey data completely. That leaves us with the previous two surveys, which seem much more trustworthy. With them as a source, we can say with some confidence that less than 1% of students in the upper years of high school are only attracted to the same sex, and approximately 6% are attracted to both sexes.
We could then conflate the two statistics and say that 7% of year 10-12 schoolchildren are “same sex attracted”, but why would we want to? Students who experience bisexual attraction are not necessarily homosexual, or even bisexual—see the figures from the Australian Studies of Health and Relationships below—and to group attraction to both sexes with attraction solely to the same sex seems calculated to mislead.
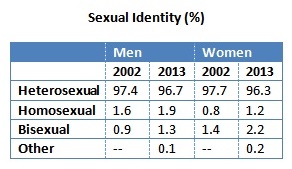
The Australian Studies of Health and Relationships
Apart from the national surveys of schoolchildren, surveys of the whole population have also been conducted. These “Australian Studies of Health and Relationships” took place in 2001-2002 and 2012-2013, and they returned the following results for sexual identity and attraction:[8]

Note that only 1.9% of men and 1.2% of women regarded themselves as homosexual in 2013 and, surprisingly, only 1.1% of men and 0.5% of women were attracted solely to the same sex. This suggests that some of those who regarded themselves as homosexual experienced bisexual attraction. Note also that most of those who are attracted to both sexes do not regard themselves as homosexual or bisexual.
Clearly then the link between attraction and sexual identity is a complex one, and the use of the formulaic statement “n% of people are same sex attracted” tells us nothing about the percentage of people who regard themselves as homosexual or bisexual. To illustrate, based on the Australian Study of Health and Relationships survey of 2013 we can say that 10.8% of people are “same-sex attracted”, but of these only 0.8% are attracted solely to the same sex, only 1.55% consider themselves homosexual (“gay” and lesbian), and only 1.75% consider themselves bisexual.[9]
With this in mind, one wonders why the school surveys did not include a question about sexual identity. Perhaps that would have helped to clarify a state of affairs which has been left unnecessarily murky.
As can be seen in the section of page 8 reproduced above, the All of Us unit guide also claims that “4% of people are transgender or gender diverse”. Surprisingly, we are not referred once again to the 2013 National Survey of Australian Secondary Students, but to a survey of schoolchildren in New Zealand.
Why?
It would seem that the problem was that the 2013 National Survey did not return a percentage for gender diversity. However this is not the whole story:
In addition to ‘male’ and ‘female’, for the first time students were given the option of ‘other’ when reporting their gender; 23 students chose the option of ‘other’. These students were not included in the sample for the report due to low cell size. Furthermore, a small number of students did not provide a valid answer when asked their gender. These students were also excluded from the sample (n=36). Three school-based responses were also excluded due to unusable responses.
(2013 National Survey of Australian Secondary Students, p.7)
Thus the 2013 survey did return a result for gender diversity, but it was not a large enough percentage to satisfy the researchers, and was ignored. A quick exercise in arithmetic reveals that 23 “other” students comprise 1.05% of the total sample of 2181 (i.e., 2119 + 23 + 36 + 3).
Unable to find a suitable Australian source, the authors of the All of Us unit guide turned to the New Zealand survey, but chose to misrepresent its findings. According to that survey:
About 1% of students reported that they were transgender (a girl who feels like she should have been a boy, or a boy who feels like he should have been a girl e.g. Trans, Queen, Fa’afafine, Whakawāhine, Tangata ira Tane, Genderqueer). Ninety-six percent were not transgender and approximately 3% were not sure. (p. 25)[10]
This result hardly supports a statement that “4% of people are transgender or gender diverse”. All that can be said with certainty is that 1% of older New Zealand schoolchildren claim to be transgender. Regarding the 3% who are not sure, we can only make conjectures, and some of these have nothing to do with gender identity.
When we consider the Australian Study of Health and Relationships of 2012-2013, even the figure of 1% looks as if it may be too high. The statistics returned by the survey of the general population show no “transgender or gender diverse” returns at all, and this with a sample size of approximately 20,000. If transgender and gender diverse individuals are 1% of the population, there should have been around 200 respondents to represent them, and it seems very unlikely that a group of 200 or more people would not have shown up in a survey conducted through telephone interviews.
If a few gender diverse respondents do appear in the Australian study, it would perhaps be among those having a sexual identity characterised by the interviewer as “Something else/other”: a mere 0.15%.[11]
The third statistic which the All of Us unit guide cites is that “1.7% of people are intersex”. The source given is an article in the American Journal of Human Biology which states that:
Adding the estimates of all known causes of nondimorphic sexual development suggests that approximately 1.7% of all live births do not conform to a Platonic ideal of absolute sex chromosome, gonadal, genital, and hormonal dimorphism. (p.161)[12]
According to the same source, if late-onset CAH is excluded from the calculations a much smaller overall percentage results:
The single largest contribution to the higher figure [1.7%] comes from late-onset CAH. If this cause of nondimorphism is deleted, the frequency estimates obtained from population surveys would come to 0.228% ... (p.161)[13]
Thus, although debatable, the statement in the All of Us unit guide is not strictly speaking wrong. However, it does need to be remembered that the word “intersex” is being used in a very broad sense.
A useful discussion of the question of how common intersex is can be found on the web site of the Intersex Society of North America (ISNA):
To answer this question in an uncontroversial way, you’d have to first get everyone to agree on what counts as intersex—and also to agree on what should count as strictly male or strictly female. That’s hard to do. How small does a penis have to be before it counts as intersex? Do you count “sex chromosome” anomalies as intersex if there’s no apparent external sexual ambiguity?...
Here’s what we do know: If you ask experts at medical centers how often a child is born so noticeably atypical in terms of genitalia that a specialist in sex differentiation is called in, the number comes out to about 1 in 1500 to 1 in 2000 births. But a lot more people than that are born with subtler forms of sex anatomy variations, some of which won’t show up until later in life.[14]
It is noteworthy that the concept of intersexuality used in the All of Us unit guide denotes a particular view of foetal sex development where divergences from the male and female norms are not regarded as disorders but as “natural variations in genital, chromosomal or other physical characteristics”.[15] This view is not universally accepted, and many “intersex variations” are regarded by doctors as “disorders of sex development”, i.e. “congenital disorders in which development of chromosomal, gonadal, or anatomical sex is atypical”.[16]
Many patients were traditionally labelled intersex (especially when the external genitalia are ambiguous at birth), but those affected and their families find the term pejorative. Consequently, a new nomenclature and classification system has been designed for disorders that cause genital abnormalities or a phenotype at variance with the genotype. This system is known as the Chicago Consensus, which discarded the term intersex in favour of the term disorder of sex development...
These changes in long-standing terminology and the subsequent new classification system have been universally accepted by health professionals and scientists working in the specialty.[17]
The All of Us unit guide does not accept the Chicago Consensus and adopts a partisan position on the issue, rather than simply presenting it objectively:
Disorders or differences of sex development (DSD) is a medical term that is sometimes used to diagnose intersex people. Many people and institutions object to the term and don’t use it because it suggests there is something wrong with intersex bodies. Most intersex bodies are still healthy bodies. (All of Us p.40)
Notice that both parties claim that intersex individuals object to the other party’s terminology. Presumably attitudes vary from one intersex individual to the next, and both parties are justified. In one view intersexuality is a way of being, to be accepted and celebrated, in the other it is a problem requiring medical attention.
One can unequivocally say that the authors of the All of Us unit guide have engaged in unethical and, for academics, unprofessional behaviour in promoting statistics which are not supported by the sources they cite, and which are “misleading and exaggerated”.[18] Only one of the three statistics—the intersex one—is a faithful adaptation of what is said in the source. Of the other two, the transgender one is a blatant misrepresentation, and the same-sex attraction one bears no relationship whatsoever to the source.
Ironically, in the latter case, had the authors reported the statistics given by the declared source accurately they could have claimed the higher figure of 16.8%, and detractors would have had to be content with finding fault with the 5th National Survey of Australian Secondary Students and Sexual Health 2013. Perhaps the authors themselves were sceptical about the 5th National Survey’s trustworthiness, and for that reason preferred to claim a lower figure that would be less likely to be questioned. One nevertheless wonders why they did not simply use the more reliable 2013 Australian Study of Health and Relationships.[19] With that they could have legitimately claimed that 10.8% of people are same sex attracted.
More importantly, one also has to ask why the authors chose to focus attention on same-sex attraction when what is really required is statistics for sexual identity. The strategy seems to be to offer the same-sex attraction statistic because it gives a much higher percentage, and then to equate same-sex attraction with a homosexual or bisexual identity, while at the same time acknowledging the literal and much broader meaning of the phrase “same-sex attraction” in the glossary (on p. 54).
The following passage perfectly illustrates the way this technique is used:
Australian and international research shows that around 10% of people are same sex attracted... We know that 75% of same sex attracted young people experience some form of homophobic abuse or bullying... (All of Us, p. 8)
At first glance it seems as if 75% of 10% of students are subjected to “homophobic abuse or bullying”—a fairly large number—but of course this is not what is meant at all. When the authors write “75% of same sex attracted young people” they mean 75% of homosexuals and bisexuals only, but when they write “10% of people are same sex attracted” they are referring to anybody who feels some degree of same-sex attraction. This could even be, judging from the glossary definition they offer, anybody who feels merely emotional attraction to his/her own sex, and would certainly include mostly heterosexuals:
Same sex attracted
People who experience feelings of sexual and/or emotional attraction to others of the same sex. This term includes people who may identify in ways such as lesbian, gay, bisexual, queer, pansexual or heterosexual, who are questioning their sexuality, or who are not wanting to label themselves. (My emphases. “Glossary and Inclusive Language,” All of Us, p. 54)
An electronic search through the All of Us pdf document for each occurrence will reveal that the phrase “same sex attraction” is used to signify only homosexuals and bisexuals in most instances. Same-sex attraction which is neither homosexual nor bisexual is nowhere considered, not even in the lesson on “Same Sex Attracted Experiences” (Lesson 2). That lesson is commandeered for the exploration of “the lives of gay, lesbian and bisexual people”, and further reinforces the equation same-sex attraction = homosexuality and bisexuality. Ironically this is a stereotypical view, and as such goes against what students are taught about stereotyping being wrong.
Most heterosexual adults know from experience that same-sex attraction is not necessarily an indicator of homosexuality or bisexuality, but a natural part of puberty and adolescence, even of heterosexuality. In adolescence it is usually just a phase, a short-lived crush, for example, and as such is a well-known phenomenon.
To equate same-sex attraction with homosexuality (and to put homosexuality and bisexuality in the same bag) when broaching these issues with impressionable young people on the threshold of puberty is likely to lead to their mistakenly believing that they might be homosexual because they feel emotionally attracted to members of their own sex from time to time. Surely students need to be reassured that same-sex attraction is not in most instances the sole or decisive factor as regards one’s sexual identity, and that it is normal for heterosexuals to occasionally feel some attraction for persons of the same sex. This is the approach which selfless objectivity dictates; and selfless objectivity is what one would expect from a teaching resource dealing with such sensitive material for students so young. Instead what one finds in these resources is a crusading zeal to make homosexuality and gender dysphoria seem much more common than they really are...
Pavlos Andronikos
October 2017
[1] From All Of Us: Health and Physical Education Resource by Christopher Bush, Roz Ward, Joel Radcliffe, Micah Scott, & Matthew Parsons (Safe Schools Coalition Australia, Minus18, n.d.) pp. 8 & 55. The same statement and footnote are to be found in Safe Schools Do Better (p. 6).
[2] Anne Mitchell, Kent Patrick, Marian Pitts, Pamela Blackman, and Wendy Heywood, 5th National Survey of Australian Secondary Students and Sexual Health 2013 (Australian Research Centre in Sex, Health & Society, La Trobe University, 2014).
[3] “Some of the findings remain surprisingly consistent, rates of sexual intercourse is an example of a finding where little changes. Another is the number of young people reporting same sex attraction, an area explored from 1997 onwards.” (5th National Survey of Australian Secondary Students and Sexual Health 2013, p. 2.)
[4] See Anthony Smith, Paul Agius, Sue Dyson, Anne Mitchell and Marian Pitts, Secondary Students and Sexual Health 2002 (Melbourne, Australian Research Centre in Sex, Health & Society, La Trobe University, 2003); and Anthony Smith, Paul Agius, Anne Mitchell, Catherine Barrett and Marian Pitts, Secondary Students and Sexual Health 2008 (Melbourne: Australian Research Centre in Sex, Health & Society, La Trobe University, 2009).
[5] In this regard, see also James A. Athanasou, “A Critical Comment on the 5th National Survey of Australian Secondary Students and Sexual Health” (March 2016; ISSN: 2206-3889) pp. 5 & 7ff.
[6]
“These numbers are higher than in previous surveys and may indicate an increased number of young people prepared to come
out as experiencing same sex attraction. However the recruitment of an online sample may also account for increased
numbers of same sex attracted young people who are known to be experienced and frequent users of online sites.” (p. 23)
And:
“It is also worth noting that there was a higher proportion of same sex attracted young people in the ROS sample.” (p. 73)
[ROS= recruited online survey]
[7] James A. Athanasou’s review of the 5th National Survey “considered that there were (a) omissions in the reporting; (b) inadequacies in the sample of schools; (c) the infection of the school survey cohort by the inclusion of an online survey; (d) the unrepresentative demographic nature of the sample; (e) problems with the validity of online survey responses; (f) concerns about the quality of the data; (g) very low school participation rates; and (h) the effects of non-response to the survey.” (James A. Athanasou, “ A Critical Comment on the 5th National Survey of Australian Secondary Students and Sexual Health”, p. 3.)
[8] See the Australian Studies of Health and Relationships 2001-2002 and 2012-2013.
[9] Despite these clear divergences between sexual attraction and sexual identity, the authors of the Victorian Department of Education and Training’s web page “Homophobic behaviour” nevertheless feel it is okay to write: “Around 10 per cent of our school communities experience feelings of same sex attraction, or identify as gay, lesbian or bisexual.” No source is cited. (See http://www.education.vic.gov.au/about/programs/bullystoppers/Pages/advicehomophobia.aspx. Also available as a pdf file at http://www.education.vic.gov.au/Documents/about/programs/bullystoppers/homophobic.pdf.)
[10]
Clark, T. C., Fleming, T., Bullen, P., Denny, S., Crengle, S., Dyson, B., Fortune, S., Lucassen, M., Peiris-John,
R., Robinson, E., Rossen, F., Sheridan, J., Teevale, T., Utter, J.,
Youth’12 Overview: The Health and
Wellbeing of New Zealand Secondary School Students in 2012. Auckland, New Zealand: The University of Auckland, 2013.
The question posed to the respondents was: “Do you think you are transgender? This is a girl who feels like she should
have been a boy, or a boy who feels like he should have been a girl (e.g. Trans, Queen, Fa’faffine, Whakawahine,
Tangata ira Tane, Genderqueer).” They were given four responses to choose from: “Yes, No, I’m not sure, I don't
understand this question”. (Adolescent Health Research Group,
Youth’12 National Health and Wellbeing Survey of New Zealand Secondary School Students: Questionnaire [Auckland: The University of Auckland, 2012], p.78.)
[11]
Apparently the procedure was for the interviewer to ask, “Do you think of yourself as...” and read out three
categories with numbers: 1) Heterosexual or straight; 2) Homosexual (gay); 3) Bisexual.
On the basis of the
response given, the interviewer would note down a number. “Not sure; undecided” was indicated with a 5; and
“Something else/other” with a 6. In the latter case the interviewer was instructed to record the response as
well as the number code. The code 4 would have signified that the self-identification was “queer”. Only 3 people
identified themselves as “queer”.
(Richters Juliet, Altman Dennis, Badcock Paul B., Smith Anthony M. A., de Visser
Richard O., Grulich Andrew E., Rissel Chris, Simpson Judy M.,“Sexual Identity, Sexual Attraction and Sexual
Experience: The Second Australian Study of Health and Relationships”.
Sexual Health vol. 11, issue 5 (2014),
pp. 451-460. See p. 453.
[12] Blackless M., Charuvastra A., Derryck A., Fausto-Sterling A., Lauzanne K, Lee E., “How Sexually Dimorphic Are We? Review and Synthesis”, American Journal of Human Biology vol. 12, no. 2 (March 2000) pp. 151-166.
[13]
Late-onset CAH or non-classic congenital adrenal hyperplasia “is a milder and later onset form of a genetic
condition known as congenital adrenal hyperplasia. Some people affected by the condition have no associated
signs and symptoms while others experience symptoms of androgen (male hormone) excess. Women with NCAH are
generally born with normal female genitalia. Later in life, signs and symptoms of the condition can vary but
may include hirsutism, frontal baldness, delayed menarche (first period), menstrual irregularities, and infertility.
Little has been published about males with NCAH. They may have early beard growth and relatively small testes.
Typically, they have normal sperm counts.”
(From
https://rarediseases.info.nih.gov/diseases/9592/non-classic-congenital-adrenal-hyperplasia-due-to-21-hydroxylase-deficiency, Oct. 2017.)
[14] The Intersex Society of North America (ISNA), “How common is intersex? Oct. 2017.”
[15]
All of Us p.54.
See also p. 36: “having intersex characteristics is part of the natural variation of human
bodies.”
“But did you know that there are a whole range of human bodies that are somewhere between what you might
expect a boy or girl to look like? These differences in bodies occur naturally and are called intersex variations.”
[16] Ieuan A. Hughes, John D. Davies, Trevor I. Bunch, Vickie Pasterski, Kiki Mastroyannopoulou, Jane MacDougall, “Androgen insensitivity syndrome”, The Lancet vol. 380, no. 9851 (2012) pp. 1419-1428. See p. 1423.
[17] Ieuan A. Hughes, John D. Davies, Trevor I. Bunch, Vickie Pasterski, Kiki Mastroyannopoulou, Jane MacDougall, “Androgen insensitivity syndrome”, The Lancet vol. 380, no. 9851 (2012) pp. 1419-1428. See p. 1423.
[18]
Patrick Parkinson, “The
Controversy over the Safe Schools Program – Finding the Sensible Centre”, p. 31.
I note here that in the pdf document Stand Out (p. 8) it is claimed that “5% or more people in Australia
are transgender or gender diverse”. No source is given.
[19]
The 2013 Australian Study of Health and Relationships was conducted by academics from the University of New South
Wales, the University of Sydney, the University of Sussex, and La Trobe University. Also the University of Melbourne, Deakin University, and Sydney Medical School. La Trobe University and the Australian Research Centre in Sex,
Health & Society were represented by Anthony Smith who “died during data collection for the... Study”. (See
http://www.ashr.edu.au/researchers/professor-anthony-smith.)
In contrast,
the 5th National Survey of Australian Secondary Students and Sexual Health 2013 was conducted solely by La Trobe
University’s Australian Research Centre in Sex, Health & Society. Anthony Smith had been chief investigator on the
1997, 2002, 2008 and 2013 surveys, but died “in the early planning stages of the current [2013] project”:
“The funding to complete the current survey was given to Professor Anthony Smith whose outstanding scholarship and
commitment to detail has ensured the integrity of these data at each survey wave since 1997...
Professor Smith died in the early planning stages of the current project and we intend this report to be a tribute
and further example of the extraordinary contribution his work has made to the sexual health and wellbeing of young
Australians.” (5th National Survey of Australian Secondary Students and Sexual Health 2013, p. 2.)
Elisabeth Taylor, “Anti-bullying Program or Political Agenda?”
Available at
https://d3n8a8pro7vhmx.cloudfront.net/acl/pages/5334/attachments/original/1481683966/ACL_Safe_Schools_Report.pdf
.
An excellent and extremely perceptive analysis of the ideology behind the Safe Schools Programme.
Some Quotes:
Contrary to popular belief, Safe Schools is not an anti-bullying program that has been hijacked by activists. It was conceived, written and promoted by activists and was always intended as a vehicle for social transformation. In facilitating the Safe Schools program, the government has outsourced curriculum development to an ideological interest group, unaccountably allowing them a free kick in the contest over the hearts and minds of the next generation. (Executive Summary)
...the Safe Schools program works to exclude and marginalise anyone who espouses the traditional views that, in general, heterosexuality and gender congruence are reasonable and desirable expectations to have for our children. (p. 2)
Although the figures asserted with such authority by the Safe Schools program do not stand up to independent examination, their frequent and confident repetition conveys the strong impression that they are factual and can be supported with evidence. This is particularly significant when the audience is predominantly made up of school students, who would be unlikely to question the evidentiary basis for something asserted as fact in the classroom. With such frequent repetition, these erroneous figures have already acquired an authority on their own. (p. 8)
Some of the links may no longer be at the same address. An internet search should bring up the current address if the source is still available.